Timmy Keegan and Tyler Dunn Septemer 14, 2018
Definition of the Problem: We needed to figure out how change in position of the buggy is affected by the time the the buggy is powered on.
IV: Time the buggy is running
DV: Change in position of the buggy
CV: Buggy, ramp, and person timing w/ stopwatch
3 Methods of Collecting Data
Stopwatch
Video Analysis
Motion Sensor
Materials used...
- Buggy
- Stopwatch
- Ramp
- Motion sensor
Data
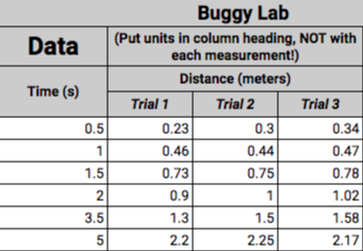
Stopwatch (raw)
Definition of the Problem: We needed to figure out how change in position of the buggy is affected by the time the the buggy is powered on.
IV: Time the buggy is running
DV: Change in position of the buggy
CV: Buggy, ramp, and person timing w/ stopwatch
3 Methods of Collecting Data
Stopwatch
- Determine where the initial position will consistently be; in this case, back wheels.
- Turn on the buggy
- Start the timer when the buggy is turned on
- Record distance traveled after half a second
- Record position of the back wheels in relation to its starting point on the ramp
- repeat all steps 2 more times to get 3 total sets of data to make results more accurate
- repeat all steps for more times between .5 and 5 seconds
Video Analysis
- Set up a camera pointing at the tracks so that the buggy is moving horizontally
- Record at least one video of the buggy going across the entire track
- Save the video
- put the video into logger pro and use their video analysis tool to collect data
Motion Sensor
- Setup the motion sensor with logger pro and angle it correctly so it can always sense the buggy
- Start the buggy and start the motion sensor simultaneously
- stop the data collection when the buggy has run for 5 seconds and stop the buggy
Materials used...
- Buggy
- Stopwatch
- Ramp
- Motion sensor
Data
Stopwatch (raw)
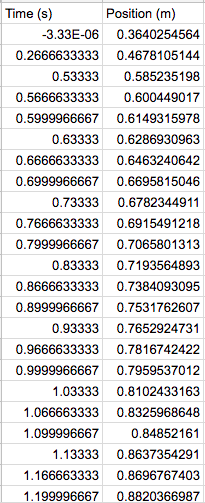
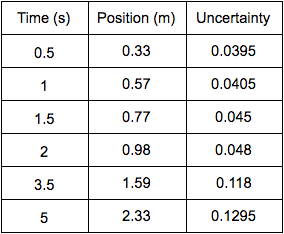
Motion Sensor
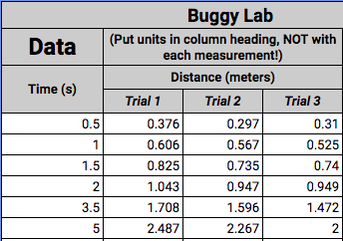
Video Analysis
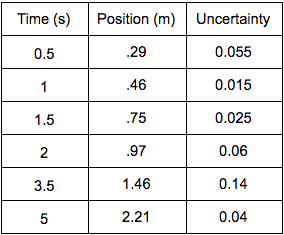
Stopwatch (Processed)
Motion Sensor (Processed)
Video Analysis Graph
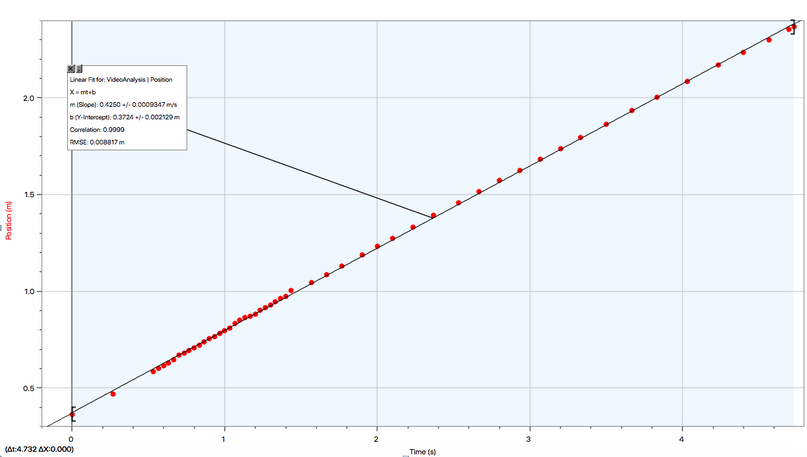
Formula:
Position = 0.4250*time + 0.3724
Slope:
4250 m/s
Interpretation
Position = 0.4250*time + 0.3724
Slope:
4250 m/s
Interpretation
- The starting position of the buggy.
- The buggy started about .3724 m from the start of the track according to the y-intercept
Stopwatch Graph

Formula
- Position = .4431 * time
- 0.4431 m/s
- Interpretation
- The slope in this represents the velocity of the buggy
- The buggy moves at a constant velocity and that is backed up by this slope
- There is no y-intercept because it starts from (0,0) because you can start it on 0 because you do not need to leave space between the buggy and the end like you do with the motion sensor

Formula
- Position = 0.4370 * time + 0.1117
- .4370 m/s
- Interpretation
- The slope in this represents the velocity of the buggy
- The buggy moves at a constant velocity and that is backed up by this slope
- 0.1117 m
- Interpretation
- The starting position of the buggy
- the buggy started about .0117 m from the start of the track according to the y-intercept
Conclusion
In conclusion,
Evaluating Procedures
Reasons that the data recorded and
In conclusion,
Evaluating Procedures
Reasons that the data recorded and
