Partners: Alina Wang, Dylan Torrey
October 13th, 2018
Experiment 1
The purpose of this lab was to find the relationship between net force of a system and the acceleration of the cart on the ramp
IV: The net force on the system
DV: Acceleration
Controls: Total mass of the system, cart, ramp, and hanger
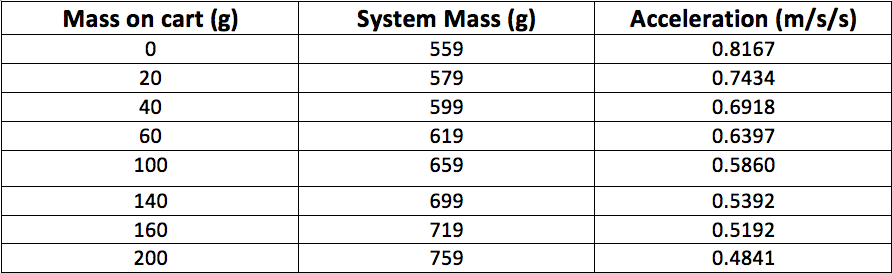
We kept the total mass constant and moved mass from the cart on to the hanger without changing the total mass of the system. This made it possible to find the correlation between net force acting on an object in the system and acceleration of that object.
Procedure:
1. Set up the lab, with the cart, sting, hanger, and weights
2. Choose a total amount of mass to use for the system and do not change it
3. Place the weights starting on the cart
4. Record data for each trail while moving mass from the cart to the hanger after each trial
5. Record and interpret data, which is the changes in mass on hanger and chart (where it was located) and note change in acceleration
6. Plug data into logger pro and analyze data
a = net force/mass
Lab Setup:
October 13th, 2018
Experiment 1
The purpose of this lab was to find the relationship between net force of a system and the acceleration of the cart on the ramp
IV: The net force on the system
DV: Acceleration
Controls: Total mass of the system, cart, ramp, and hanger
We kept the total mass constant and moved mass from the cart on to the hanger without changing the total mass of the system. This made it possible to find the correlation between net force acting on an object in the system and acceleration of that object.
Procedure:
1. Set up the lab, with the cart, sting, hanger, and weights
2. Choose a total amount of mass to use for the system and do not change it
3. Place the weights starting on the cart
4. Record data for each trail while moving mass from the cart to the hanger after each trial
5. Record and interpret data, which is the changes in mass on hanger and chart (where it was located) and note change in acceleration
6. Plug data into logger pro and analyze data
a = net force/mass
Lab Setup:

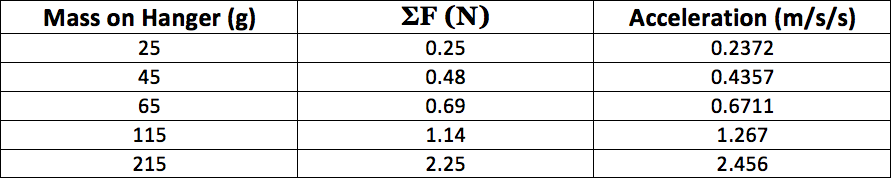
Raw Data
Total mass of the system: 565 g / 0.565 kg
Interpreted Data
The data is analyzed by plugging it into logger pro, finding the line of best fit, and a equation representing the relationship between acceleration and net force is evident.
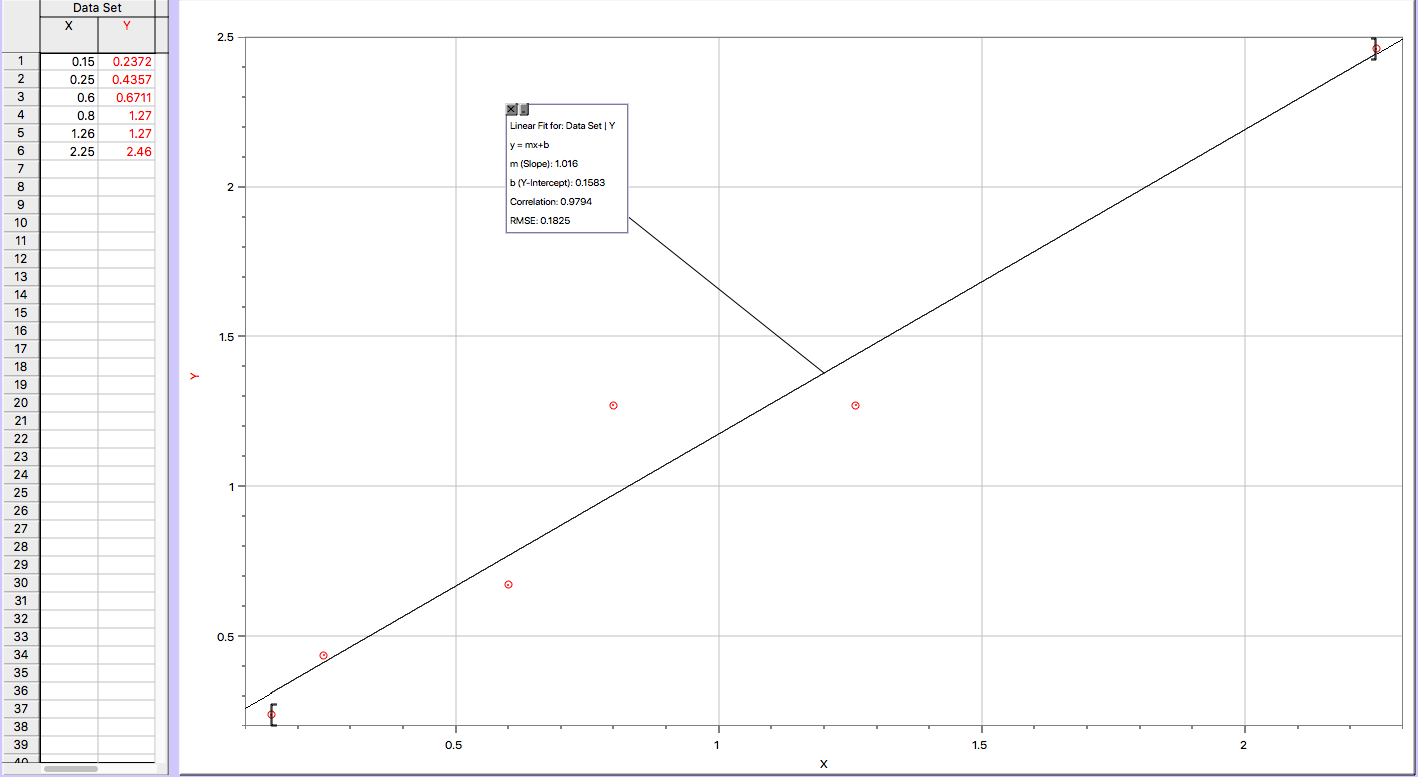
This linear fit represents a mathematical model that shows how acceleration is directly proportional to Net Force
Formula -- Acceleration = 1.016m/s/s/N * ∑F + 0.1583
The y-intercept is [0.1583], which is roughly accurate since one would expect that when something has zero force applied to it the acceleration of that object forces are applied to would also be zero.
Formula -- Acceleration = 1.016m/s/s/N * ∑F + 0.1583
The y-intercept is [0.1583], which is roughly accurate since one would expect that when something has zero force applied to it the acceleration of that object forces are applied to would also be zero.
Experiment 2
The purpose of the second experiment was to find the relationship between the total mass acting on a system and the acceleration of an object within that system and/or relative to that system.
IV: Total Mass
DV: Acceleration
Controls: Net Force
Net Force is a constant in this experiment because with the purpose being to determine the relationship between total mass of the system and acceleration of an object in the system, having the net force different among multiple trials would skew the data in a way that would affect the acceleration data points and lose the meaning and integrity of the experiment.
Procedure:
- Measure mass of hanger and mass on it in grams (this will also be the net force)
- Collect motion sensor data with logger pro and sensor to make a velocity vs. time graph
- Record the mass of the system
- Release the cart so that it moves along the ramp
- Analyze logger pro data and find the acceleration by using the velocity vs. time graph
- Change the total system mass with each trial and repeat previous steps until desired number of trials are reached
Raw Data:
Mass on the hanger = 55 grams or 0.55g
∑F = Fg = m*g = 0.55 kg * 9.8 N/kg = 0.539N
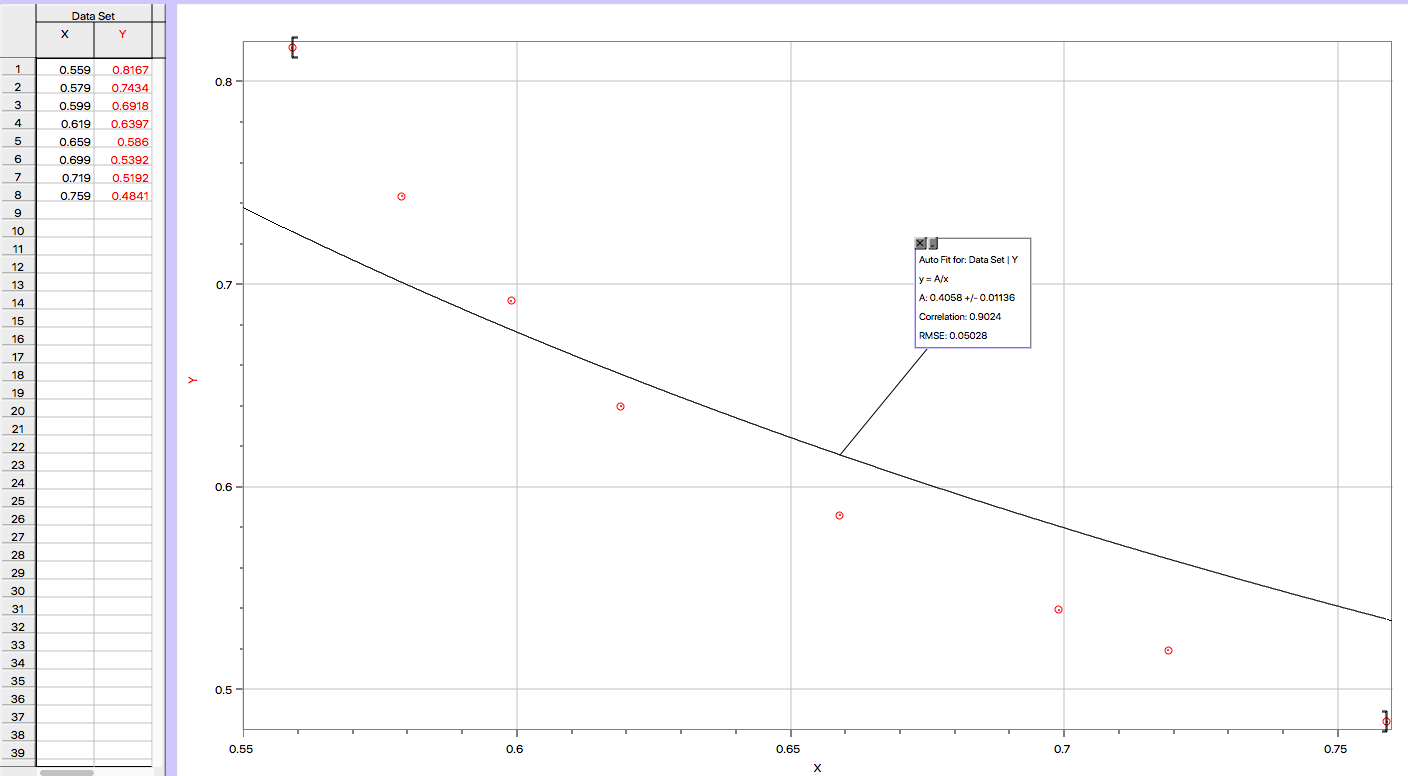
Interpreted Data
The data points recorded were plugged into logger pro to be analyzed and interpreted into a inverse fit